Contour Basics for Site Grading: Reading Contour Maps
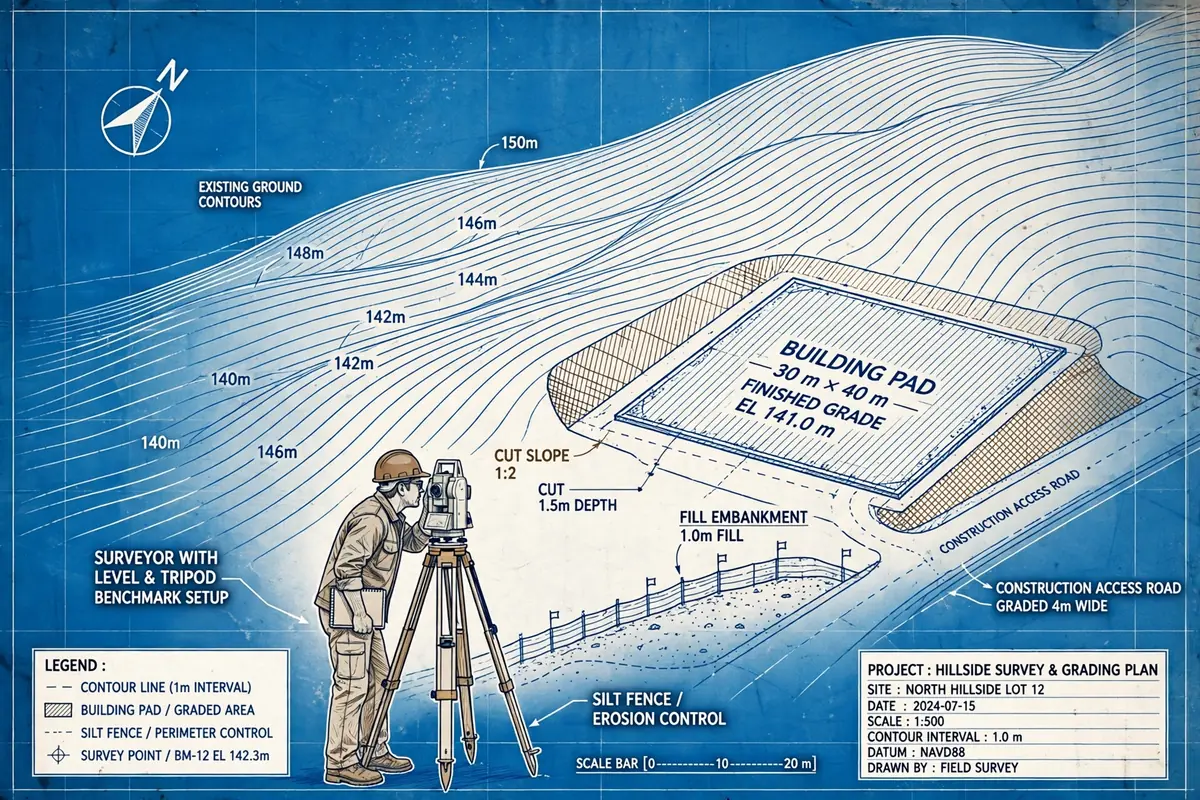
Learn contour basics for site grading: contour intervals, reading slopes and valleys, and a worked cut-and-fill example for setting levels on site.
Hand a junior engineer a contour plan on their first week on site and you will often see the same reaction: a polite nod, followed by a quiet struggle to turn those wavy lines into a picture of the ground. Yet once you learn to read contours, a flat drawing starts to speak. You can see where the ground rises, where water will run, where a road will need cutting, and where a building pad will sit comfortably without a mountain of fill.
This guide covers contour basics for site grading in plain language: what a contour line is, how to judge slope from line spacing, how to spot hills, valleys and ridges, and how to turn a contour plan into a simple cut-and-fill estimate.
What Is a Contour Line?
A contour line joins points of equal elevation above a datum. If you walked along the 102 m contour, you would stay at exactly 102 m above datum the whole way, even as the line bends around the hillside. The next line might be 103 m, then 104 m, and so on. In other words, a contour plan is a set of horizontal slices through the ground, drawn at regular height steps.
The vertical step between neighbouring contours is called the contour interval. On a detailed site plan it is commonly 0.5 m or 1 m. On a broader topographical map it might be 5 m or 10 m. A small interval shows gentle detail but can look crowded on steep ground. A large interval is cleaner but hides small humps and hollows that matter when you are grading a pad or a driveway.
Every fifth contour is usually drawn thicker and labelled. These are index contours, and they are your shortcut for reading a plan quickly. Instead of counting every thin line, find the nearest thick, labelled line and count up or down from there. Always check the interval printed in the title block or legend before you start counting. Assuming a 1 m interval when the plan actually uses 0.5 m will double every height difference you calculate, and that is exactly the kind of quiet error that leads to a pad set half a metre too high.
How to Read Slope from Contour Spacing
The single most useful rule in contour reading is simple: closely spaced contours mean steep ground, and widely spaced contours mean gentle ground. If the lines are evenly spaced, the slope is uniform. If they bunch together in one place and spread out in another, the slope changes — steep where they bunch, flat where they spread.
That spacing also lets you calculate the gradient. Gradient is the vertical rise divided by the horizontal distance, and it is usually written as a ratio, a percentage, or both.
Worked example — gradient between two contours. Two neighbouring contours are 102 m and 103 m, so the contour interval is 1 m. Measured on the ground, the horizontal distance between them at one point is 50 m. The gradient is therefore 1 ÷ 50, which is 1 in 50, or 2%. That is a gentle, easily walkable slope and a comfortable grade for a grassed area or a yard.
Now take the same 1 m interval but a horizontal distance of only 10 m. The gradient becomes 1 ÷ 10, which is 1 in 10, or 10%. That is steep for a vehicle access and would need careful thought about surfacing, drainage and erosion. The same pair of lines tells two very different stories, and the only difference is how far apart they sit on the plan.
Spotting Hills, Valleys, Ridges and Depressions
Once you can read slope, the shapes start to appear. Closed, roughly circular contours with values increasing towards the centre mark a hill or a knoll. The innermost loop is the summit area. Closed contours with values decreasing towards the centre mark a depression or a pit, and they are often drawn with short tick marks pointing downhill into the hollow.
A valley shows up as a set of contours that bend upstream, forming a V shape that points uphill. Water, if it flows there, runs in the opposite direction, downhill and out through the open end of the V. A ridge is the mirror image: contours bend to form a U or V pointing downhill, with higher ground inside the bend. A spur is a smaller ridge running off a larger hill, while a saddle is the low point between two hills, where contours pinch in from both sides.
Why does this matter for grading? Because water follows the valleys, not your drawings. Place a pad across a valley without a drainage plan and you have built a dam. Reading these shapes before pegging out saves rework.
Estimating the Height of a Point Between Contours
Not every point you need sits neatly on a contour line. Often you need the approximate level of a peg, a corner or an existing drain that falls between two lines. You can estimate it by interpolation, which is just a fancy word for judging where the point sits between the two known heights.
Worked example — interpolating a level. A proposed gate post sits between the 102 m and 103 m contours. On the plan, the post is about three-quarters of the way from the 102 m line towards the 103 m line. Its approximate level is 102 m plus 0.75 × 1 m, which is 102.75 m. That is good enough for a first grading sketch and for checking whether the gate area will drain towards the road or back towards the house.
Interpolation assumes even ground between the contours, so treat it as an estimate. Confirm finished levels with a level instrument or total station, never by scaling off the plan alone.
From Contours to a Grading Plan
Site grading is the shaping of the ground so that it drains where you want it to, supports what you are building, and needs as little imported or exported material as possible. A contour plan is the starting point, and the design process usually follows a practical sequence.
First, mark the fixed levels you cannot change: the road level at the access point, an existing drain invert, a neighbouring finished floor, or a tree root zone that must not be buried. Second, sketch the proposed finished levels for the pad, yard and access, keeping falls away from the building. A common rule is to fall away from the walls for at least the first few metres so that surface water does not sit against the structure.
Third, compare existing and proposed levels across the site. Where the proposed level is lower than the existing ground, you cut. Where it is higher, you fill. The boundary between cut and fill is the daylight line, where the two surfaces meet and no earthworks are needed. A good grading design balances cut and fill so that material moved from the high side fills the low side, rather than paying to cart soil in one direction and spoil away in the other.
Fourth, check drainage paths on the proposed contours. At every low point, ask where water goes from here. If the answer is into a corner, against a wall or onto a neighbour's land, the grading needs another pass.
Worked Example: Cut-and-Fill Volume Between Contours
Contour areas give a quick way to estimate earthwork volume before a detailed survey model is built. The method below uses the end-area formula, which averages the areas enclosed by two successive contours and multiplies by the contour interval. It is an estimate, not a substitute for a surveyed volume calculation, but it is excellent for checking whether a scheme is roughly balanced.
Suppose a small knoll is to be graded down towards a 100 m formation level. The areas enclosed by the contours, measured from the plan with a planimeter or CAD area tool, are 2,400 m² at the 100 m contour, 1,800 m² at the 101 m contour, and 1,100 m² at the 102 m contour. The contour interval is 1 m.
The volume between the 100 m and 101 m contours is (2,400 + 1,800) ÷ 2 × 1 m, which is 2,100 m³. The volume between the 101 m and 102 m contours is (1,800 + 1,100) ÷ 2 × 1 m, which is 1,450 m³. Adding the two layers gives a total volume above the 100 m level of 3,550 m³.
In practice, allow for bulking, compaction, topsoil stripping and unsuitable material. A contour volume is a starting point for haul planning, to be refined with a detailed survey model. The grading levels and the structural levels governed by standards such as IS 456 and ACI 318 must also be coordinated, not designed in isolation.
Common Mistakes When Reading Contours
- Ignoring the contour interval. Always read it from the legend. Guessing it is the fastest way to get every height wrong.
- Confusing a valley with a ridge. Check which way the values increase. The V points uphill in a valley and downhill on a ridge.
- Forgetting that contours never split or cross. If two lines appear to meet, you are probably looking at an overhang, a cliff, or a drawing error. On ordinary ground, each contour is a single continuous line.
- Scaling levels off a printed plan. Paper stretches, printers rescale, and a small scaling error becomes a large level error. Use surveyed levels for setting out.
- Grading to a flat pad with no fall. A perfectly level pad ponds. Even a gentle 1% to 2% fall, shaped deliberately, keeps water moving.
- Designing cut and fill without checking haul routes. Balanced volumes still cost money if machines cannot reach the fill area without crossing finished work.
Site Checks Before You Trust the Plan
Before pegging a grading design, walk the site with the plan in hand. Check the high and low points, look for missed features such as a rock outcrop or old drain, and confirm the benchmark and datum — a datum mismatch sets every level out by a constant, expensive error.
Also confirm the survey date. If the ground looks different from the plan, get the survey updated rather than forcing the design to fit an old drawing.
Frequently Asked Questions
What is the difference between a contour line and a contour interval?
A contour line is a single line joining points of equal elevation. The contour interval is the vertical distance between neighbouring contour lines, such as 0.5 m or 1 m. The line shows where a level occurs; the interval tells you how big each step is.
Can two contour lines cross each other?
On ordinary ground, no. Each point on the ground has only one elevation, so two different contour lines cannot pass through the same point. Apparent crossings usually indicate a cliff, an overhang, or a drawing error that should be queried with the surveyor.
How accurate is a volume estimated from contours?
It is a useful preliminary estimate. Accuracy depends on the contour interval, the survey quality and how evenly the ground slopes between contours. For tender or final payment, use a surveyed digital terrain model and a recognised volume method rather than a contour estimate alone.
What slope is best for surface drainage around a building?
As a practical starting point, grade the ground to fall away from the building at about 2% for the first few metres, then tie into the site drainage. The exact fall depends on the surface, local rainfall and any applicable local code, so confirm it with the project engineer.
Contour reading is not a party trick for exams. It is the skill that lets you look at a flat sheet and see the site in three dimensions before a machine moves. Learn the interval, respect the spacing, follow the water, and check the ground with your own feet. Do that, and your grading plans will be simpler, cheaper and far less likely to surprise you when the first rain falls.
Calculations and engineering guides are for planning and educational reference. Verify final designs against applicable codes with a licensed Professional Engineer.